This tutorial demonstrates how to tabulate observations from a data cube. We’ll convert the one observation per row “tidy” format into a table that looks like the original publication.
Our target is the UK Sea Fisheries Statistics, an adhoc release from the Marine Management Organisation.
The data is provided as a spreadsheet. The first table looks like this:
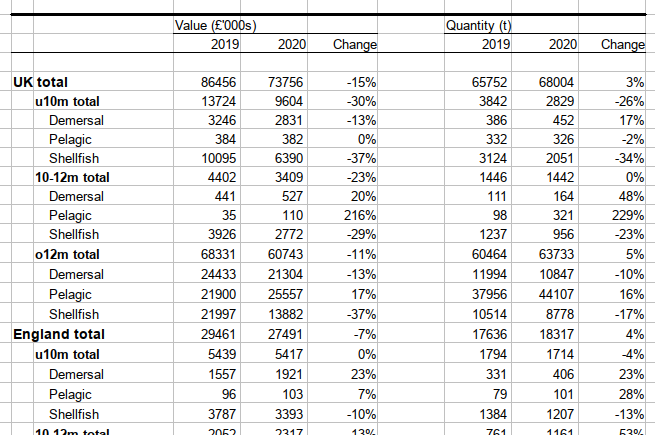
Fisheries Statistics as they in the upstream release
This is a cross-tabulation with row grouping and stacked column headers. The rows show three variables, with fishing activity grouped by Country, Vessel Length, and Species Group. The columns distinguish two measures - quantity and value, within this we have columns for years and a calculation of the change between 2019 and 2020.
This dataset is available as a DataCube on the COGS website. Here’s a screenshot:
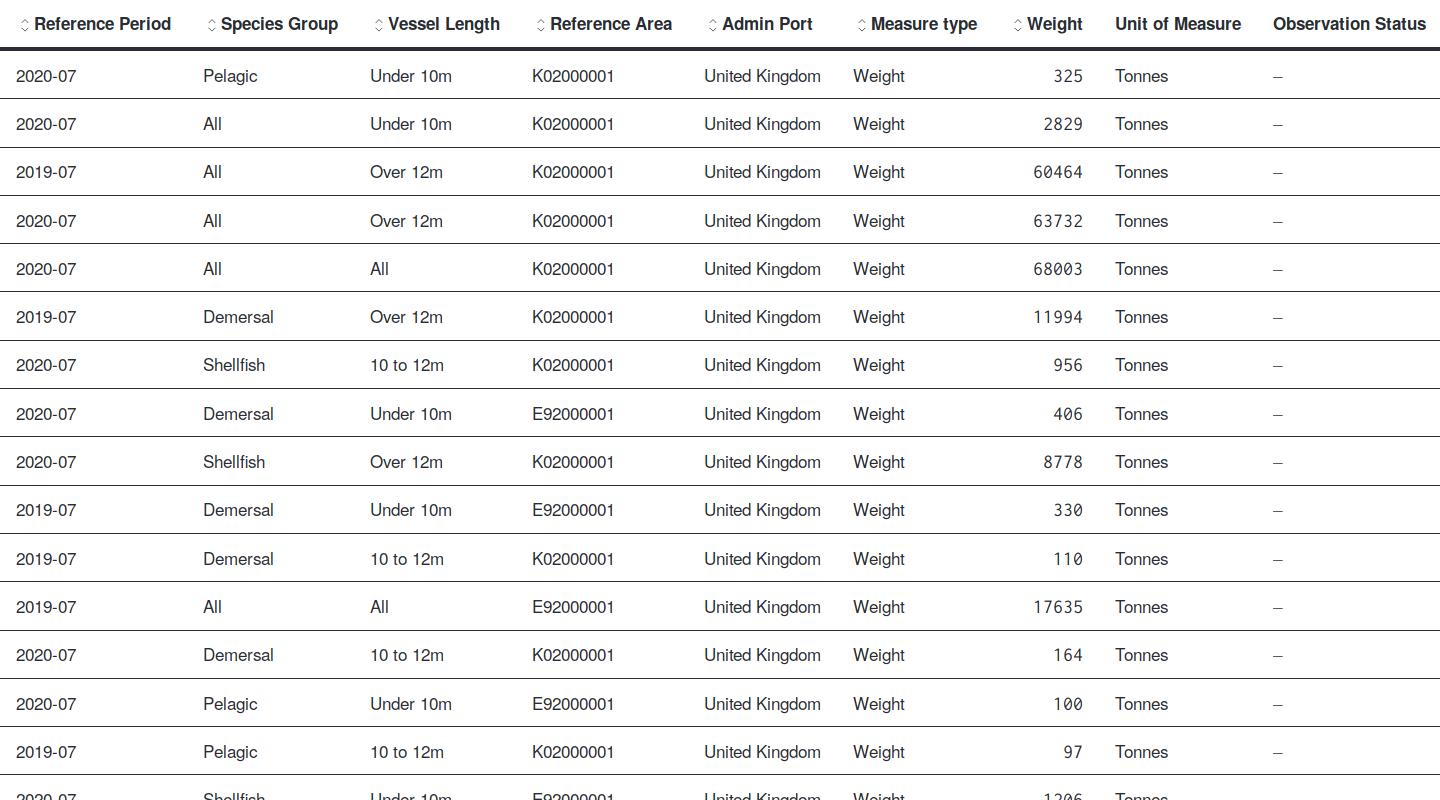
Fisheries Statistics as they appear on COGS
We can extract this into a linked-data frame.
fish <- get_cube("http://gss-data.org.uk/data/gss_data/covid-19/mmo-ad-hoc-statistical-release-uk-sea-fisheries-statistics#dataset")
This data frame looks like this (peeking at the first 10 rows):
library(kableExtra)

peak <- function(df) {
  df %>% head() %>% kbl()
}

peak(fish)
| admin_port | reference_area | measure_type | species_group | vessel_length | reference_period | weight | unit_of_measure | observation_status |
|---|---|---|---|---|---|---|---|---|
| United Kingdom | United Kingdom | Weight | All | All | 2019 | 70510 | Tonnes | NA |
| United Kingdom | United Kingdom | Weight | All | Under 10m | 2019 | 3394 | Tonnes | NA |
| United Kingdom | United Kingdom | Weight | Demersal | Under 10m | 2019 | 391 | Tonnes | NA |
| United Kingdom | United Kingdom | Weight | Pelagic | Under 10m | 2019 | 187 | Tonnes | NA |
| United Kingdom | United Kingdom | Weight | Shellfish | Under 10m | 2019 | 2815 | Tonnes | NA |
| United Kingdom | United Kingdom | Weight | All | 10 to 12m | 2019 | 2269 | Tonnes | NA |
We can recreate the cross-tabulation as follows:
library(tidyr)

fish_table <- fish %>%
  filter(label(admin_port)=="United Kingdom") %>%
  pivot_wider(id_cols=c(reference_area, vessel_length, species_group),
              names_from=c(measure_type, reference_period),
              names_glue="{label(measure_type)}_{label(reference_period)}",
              values_from=weight) %>%
  arrange(reference_area, vessel_length, species_group) %>%
  mutate(change=(`Weight_2020-11`/`Weight_2019`)-1)
The first 10 rows of which look like:
peak(fish_table)
| reference_area | vessel_length | species_group | Weight_2019 | Weight_2020-11 | change |
|---|---|---|---|---|---|
| England | All | All | 18172 | 17889 | -0.0155734 |
| England | Under 10m | All | 1796 | 1512 | -0.1581292 |
| England | Under 10m | Demersal | 361 | 309 | -0.1440443 |
| England | Under 10m | Pelagic | 183 | 177 | -0.0327869 |
| England | Under 10m | Shellfish | 1251 | 1025 | -0.1806555 |
| England | 10 to 12m | All | 1590 | 1274 | -0.1987421 |
We can produce something formatted like the original as follows:
library(scales)

fish_table %>%
  mutate(change=percent(change, accuracy=1)) %>%
  rename("Area"=reference_area, "Vessel Length"=vessel_length, "Species Group"=species_group,
         "2019"=`Weight_2019`, "2020"=`Weight_2020-11`, "Change"=change) %>%
  kbl(caption="Activity of the UK fishing fleet by country, vessel length and species group", escape=F) %>%
  kable_classic(full_width = F) %>%
  column_spec(6, extra_css = "text-align: right") %>%
  add_header_above(c(" "=3,"Quantity (t)"=3)) %>%
  collapse_rows(columns = 1:3, valign = "top")
|
Quantity (t)
|
|||||
|---|---|---|---|---|---|
| Area | Vessel Length | Species Group | 2019 | 2020 | Change |
| England | All | All | 18172 | 17889 | -2% |
| England | Under 10m | All | 1796 | 1512 | -16% |
| England | Under 10m | Demersal | 361 | 309 | -14% |
| England | Under 10m | Pelagic | 183 | 177 | -3% |
| England | Under 10m | Shellfish | 1251 | 1025 | -18% |
| England | 10 to 12m | All | 1590 | 1274 | -20% |
| England | 10 to 12m | Demersal | 155 | 121 | -22% |
| England | 10 to 12m | Pelagic | 882 | 724 | -18% |
| England | 10 to 12m | Shellfish | 552 | 428 | -22% |
| England | Over 12m | All | 14785 | 15102 | 2% |
| England | Over 12m | Demersal | 4887 | 3207 | -34% |
| England | Over 12m | Pelagic | 5889 | 8845 | 50% |
| England | Over 12m | Shellfish | 4008 | 3049 | -24% |
| England | All | Demersal | 5403 | 3638 | -33% |
| England | All | Pelagic | 6956 | 9747 | 40% |
| England | All | Shellfish | 5812 | 4503 | -23% |
| England | 12 to 15m | All | 3564 | 2901 | -19% |
| England | 15 to 24m | All | 1778 | 1424 | -20% |
| England | Over 24m | All | 9442 | 10776 | 14% |
| United Kingdom | All | All | 70510 | 64626 | -8% |
| United Kingdom | Under 10m | All | 3394 | 2145 | -37% |
| United Kingdom | Under 10m | Demersal | 391 | 320 | -18% |
| United Kingdom | Under 10m | Pelagic | 187 | 226 | 21% |
| United Kingdom | Under 10m | Shellfish | 2815 | 1599 | -43% |
| United Kingdom | 10 to 12m | All | 2269 | 1549 | -32% |
| United Kingdom | 10 to 12m | Demersal | 161 | 122 | -24% |
| United Kingdom | 10 to 12m | Pelagic | 882 | 724 | -18% |
| United Kingdom | 10 to 12m | Shellfish | 1225 | 702 | -43% |
| United Kingdom | Over 12m | All | 64846 | 60931 | -6% |
| United Kingdom | Over 12m | Demersal | 13671 | 10557 | -23% |
| United Kingdom | Over 12m | Pelagic | 41636 | 43358 | 4% |
| United Kingdom | Over 12m | Shellfish | 9537 | 7015 | -26% |
| United Kingdom | All | Demersal | 14224 | 11000 | -23% |
| United Kingdom | All | Pelagic | 42707 | 44308 | 4% |
| United Kingdom | All | Shellfish | 13578 | 9317 | -31% |
| United Kingdom | 12 to 15m | All | 4231 | 3370 | -20% |
| United Kingdom | 15 to 24m | All | 8705 | 6530 | -25% |
| United Kingdom | Over 24m | All | 51908 | 51029 | -2% |
| Northern Ireland | All | All | 4239 | 610 | -86% |
| Northern Ireland | Under 10m | All | 162 | 53 | -67% |
| Northern Ireland | Under 10m | Demersal | 0 | 0 | NA |
| Northern Ireland | Under 10m | Pelagic | 0 | 0 | NA |
| Northern Ireland | Under 10m | Shellfish | 161 | 53 | -67% |
| Northern Ireland | 10 to 12m | All | 113 | 88 | -22% |
| Northern Ireland | 10 to 12m | Demersal | 0 | 0 | NA |
| Northern Ireland | 10 to 12m | Pelagic | 0 | 0 | NA |
| Northern Ireland | 10 to 12m | Shellfish | 112 | 88 | -21% |
| Northern Ireland | Over 12m | All | 3963 | 468 | -88% |
| Northern Ireland | Over 12m | Demersal | 106 | 50 | -53% |
| Northern Ireland | Over 12m | Pelagic | 3190 | 200 | -94% |
| Northern Ireland | Over 12m | Shellfish | 667 | 216 | -68% |
| Northern Ireland | All | Demersal | 107 | 51 | -52% |
| Northern Ireland | All | Pelagic | 3190 | 200 | -94% |
| Northern Ireland | All | Shellfish | 941 | 358 | -62% |
| Northern Ireland | 12 to 15m | All | 190 | 103 | -46% |
| Northern Ireland | 15 to 24m | All | 545 | 140 | -74% |
| Northern Ireland | Over 24m | All | 3228 | 224 | -93% |
| Scotland | All | All | 47665 | 45819 | -4% |
| Scotland | Under 10m | All | 1306 | 478 | -63% |
| Scotland | Under 10m | Demersal | 17 | 6 | -65% |
| Scotland | Under 10m | Pelagic | 3 | 48 | 1 500% |
| Scotland | Under 10m | Shellfish | 1284 | 423 | -67% |
| Scotland | 10 to 12m | All | 457 | 151 | -67% |
| Scotland | 10 to 12m | Demersal | 0 | 0 | NA |
| Scotland | 10 to 12m | Pelagic | 0 | 0 | NA |
| Scotland | 10 to 12m | Shellfish | 456 | 150 | -67% |
| Scotland | Over 12m | All | 45901 | 45189 | -2% |
| Scotland | Over 12m | Demersal | 8604 | 7223 | -16% |
| Scotland | Over 12m | Pelagic | 32557 | 34311 | 5% |
| Scotland | Over 12m | Shellfish | 4740 | 3654 | -23% |
| Scotland | All | Demersal | 8623 | 7230 | -16% |
| Scotland | All | Pelagic | 32560 | 34360 | 6% |
| Scotland | All | Shellfish | 6481 | 4228 | -35% |
| Scotland | 12 to 15m | All | 392 | 346 | -12% |
| Scotland | 15 to 24m | All | 6351 | 4894 | -23% |
| Scotland | Over 24m | All | 39157 | 39949 | 2% |
| Wales | All | All | 433 | 307 | -29% |
| Wales | Under 10m | All | 129 | 100 | -22% |
| Wales | Under 10m | Demersal | 12 | 4 | -67% |
| Wales | Under 10m | Pelagic | 0 | 0 | NA |
| Wales | Under 10m | Shellfish | 117 | 96 | -18% |
| Wales | 10 to 12m | All | 108 | 35 | -68% |
| Wales | 10 to 12m | Demersal | 4 | 0 | -100% |
| Wales | 10 to 12m | Pelagic | 0 | 0 | NA |
| Wales | 10 to 12m | Shellfish | 103 | 35 | -66% |
| Wales | Over 12m | All | 195 | 170 | -13% |
| Wales | Over 12m | Demersal | 73 | 75 | 3% |
| Wales | Over 12m | Pelagic | 0 | 0 | NA |
| Wales | Over 12m | Shellfish | 121 | 94 | -22% |
| Wales | All | Demersal | 90 | 79 | -12% |
| Wales | All | Pelagic | 0 | 0 | NA |
| Wales | All | Shellfish | 342 | 227 | -34% |
| Wales | 12 to 15m | All | 84 | 19 | -77% |
| Wales | 15 to 24m | All | 30 | 71 | 137% |
| Wales | Over 24m | All | 80 | 80 | 0% |